learn from https://www.kaggle.com/learn/feature-engineering
上一篇:Feature Engineering 特征工程 2. Categorical Encodings 从原始数据创建新特征是改进模型的最佳方法之一 最简单方法之一是组合特征 发现最顶上的7个数据是错误的(时间一样),本节里暂时不去考虑 比如,电影之类的上映,如果同类型的扎堆了,可能被对手抢占了份额 Transforming numerical features,一些模型在数据分布是正态分布的时候,工作的很好,所以可以对数据进行开方、取对数转换 上一篇:Feature Engineering 特征工程 2. Categorical Encodings
下一篇:Feature Engineering 特征工程 4. Feature Selection
例如,数据有很长连续时间的,我们可以把最近一周的提取出来作为一个新的特征1. 组合特征
例如,如果一条记录的国家/地区为"CA",类别为"Music",则可以创建一个新值" CA_Music"
可以从所有分类特征中构建组合特征,也可以使用三个或更多特征进行交互,但是效果往往会变坏
interactions = ks['category']+'_'+ks['country'],像python一样直接相加interactions.head(10)0 Poetry_GB 1 Narrative Film_US 2 Narrative Film_US 3 Music_US 4 Film & Video_US 5 Restaurants_US 6 Food_US 7 Drinks_US 8 Product Design_US 9 Documentary_US dtype: object
assign进数据label_enc = LabelEncoder() data_interaction = X.assign(category_country= label_enc.fit_transform(interactions)) data_interaction.head() 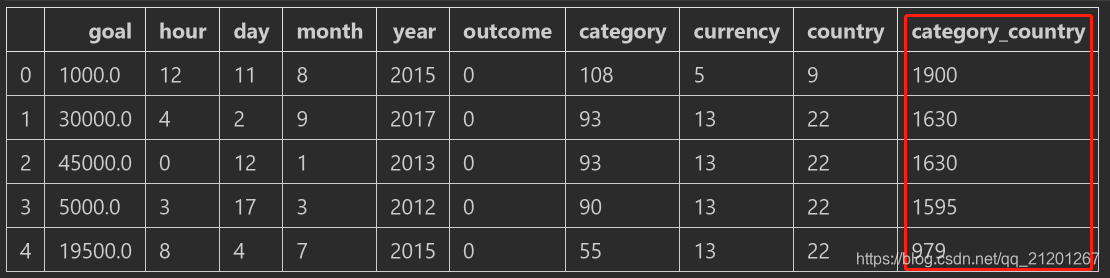
2. 过去7天的数据
launched = pd.Series(ks.index, index=ks.launched, name="count_7_days").sort_index() # 数据值为索引, 新的索引为建立的时间,新特征名称, 按索引(时间)排序 launched.head(20) launched 1970-01-01 01:00:00 94579 1970-01-01 01:00:00 319002 1970-01-01 01:00:00 247913 1970-01-01 01:00:00 48147 1970-01-01 01:00:00 75397 1970-01-01 01:00:00 2842 1970-01-01 01:00:00 273779 2009-04-21 21:02:48 169268 2009-04-23 00:07:53 322000 2009-04-24 21:52:03 138572 2009-04-25 17:36:21 325391 2009-04-27 14:10:39 122662 2009-04-28 13:55:41 213711 2009-04-29 02:04:21 345606 2009-04-29 02:58:50 235255 2009-04-29 04:37:37 98954 2009-04-29 05:26:32 342226 2009-04-29 06:43:44 275091 2009-04-29 13:52:03 284115 2009-04-29 22:08:13 32898 Name: count_7_days, dtype: int64
.rolling('7d'),设置一个窗口count_7_days = launched.rolling('7d').count()-1 # -1表示不包含当前日期 print(count_7_days.head(20)) launched 1970-01-01 01:00:00 0.0 1970-01-01 01:00:00 1.0 1970-01-01 01:00:00 2.0 1970-01-01 01:00:00 3.0 1970-01-01 01:00:00 4.0 1970-01-01 01:00:00 5.0 1970-01-01 01:00:00 6.0 2009-04-21 21:02:48 0.0 2009-04-23 00:07:53 1.0 2009-04-24 21:52:03 2.0 2009-04-25 17:36:21 3.0 2009-04-27 14:10:39 4.0 2009-04-28 13:55:41 5.0 2009-04-29 02:04:21 5.0 2009-04-29 02:58:50 6.0 2009-04-29 04:37:37 7.0 2009-04-29 05:26:32 8.0 2009-04-29 06:43:44 9.0 2009-04-29 13:52:03 10.0 2009-04-29 22:08:13 11.0 Name: count_7_days, dtype: float64 %matplotlib inline import matplotlib.pyplot as plt plt.rcParams['font.sans-serif'] = 'SimHei' plt.plot(count_7_days[7:]); plt.title("最近7天的数据") plt.show() 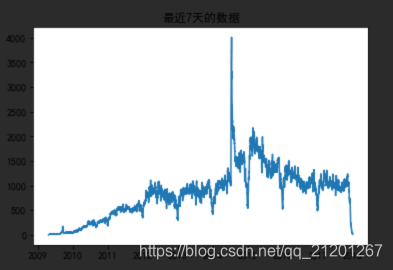
reindex后,跟原数据合并count_7_days.index = launched.values count_7_days = count_7_days.reindex(ks.index) count_7_days.head(10) 0 1487.0 1 2020.0 2 279.0 3 984.0 4 752.0 5 522.0 6 708.0 7 1566.0 8 1048.0 9 975.0 Name: count_7_days, dtype: float64
X.join(count_7_days).head(10),join合并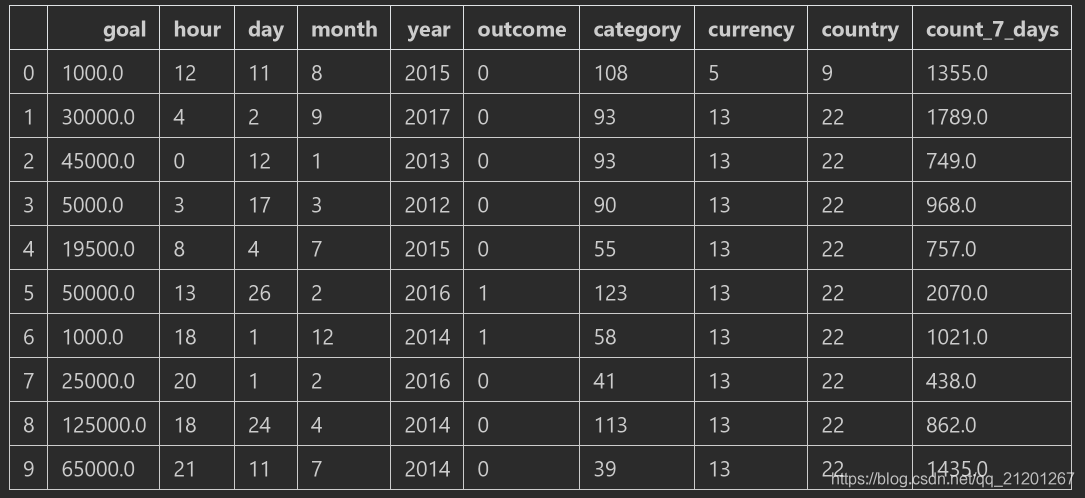
3. 上一个相同类型的项目的时间
def time_since_last_project(series): return series.diff().dt.total_seconds()/3600 df = ks[['category','launched']].sort_values('launched') # 按时间排序 timedeltas = df.groupby('category').transform(time_since_last_project) # 按分类分组,然后调用函数进行转换,算得上一个同类的时间跟自己的间隔是多少小时 timedeltas.head(20) 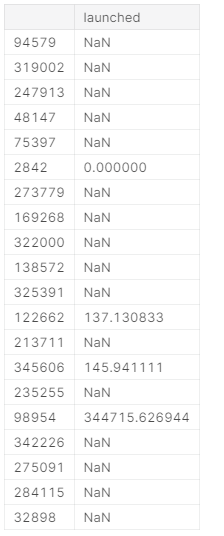
timedeltas = timedeltas.fillna(timedeltas.median()).reindex(X.index) timedeltas.head(20) 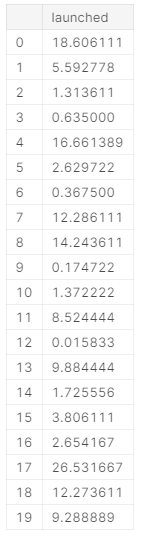
4. 转换数值特征
plt.hist(ks.goal, range=(0, 100000), bins=50); plt.title('Goal'); 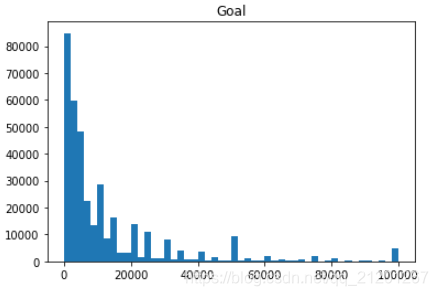
plt.hist(np.sqrt(ks.goal), range=(0, 400), bins=50); plt.title('Sqrt(Goal)'); 
plt.hist(np.log(ks.goal), range=(0, 25), bins=50); plt.title('Log(Goal)'); 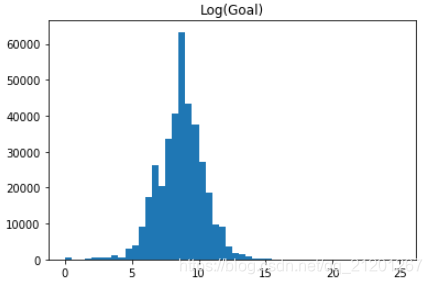
下一篇:Feature Engineering 特征工程 4. Feature Selection
本网页所有视频内容由 imoviebox边看边下-网页视频下载, iurlBox网页地址收藏管理器 下载并得到。
ImovieBox网页视频下载器 下载地址: ImovieBox网页视频下载器-最新版本下载
本文章由: imapbox邮箱云存储,邮箱网盘,ImageBox 图片批量下载器,网页图片批量下载专家,网页图片批量下载器,获取到文章图片,imoviebox网页视频批量下载器,下载视频内容,为您提供.
阅读和此文章类似的: 全球云计算
 官方软件产品操作指南 (170)


 2万+
2万+