这篇文章讲述的是Matplotlib常用图形。希望这篇数据清洗的文章对您有所帮助!如果您有想学习的知识或建议,可以给作者留言~ 数据的初步诊断 若数据量适中,人为观察是直观可行的方式 数据可视化借助图形,图标等手段,从数据集中抽取有效信息,并对其进行展观 Matplotlib是Python最著名的绘图库 采集数据 散点图可体现两个属性值的对比 上图我们可以看到是不相关的,如果相关的话是会聚集到对角线附近 如果想要查看属性的分布情况时,可以使用条形图 drawstyle用于选择插值方式 用于设置坐标轴范围 箱纸图可用于显示数据的分布情况 各位路过的朋友,如果觉得可以学到些什么的话,点个赞再走吧,欢迎各位路过的大佬评论,指正错误,也欢迎有问题的小伙伴评论留言,私信。每个小伙伴的关注都是本人更新博客的动力!!!
Chapter02 | Matplotlib常用图形
一、可视化探索
一般情况下,需要借助外部工具和手段进行数据的初步判定
从视觉上快速感知、了解数据集
多维度观察“平面”数据二、Matplotlib
提供于Matlab相似的命令API,适合交互式制图
方便地将它作为绘图控件,嵌入到GUI应用程序中
绘图文档完备,在Gallery页面中有上百幅缩略图和源程序可供查看1、Matplotlib简介
数据可视化交接数据统计特征
可绘制散点图,折线图,分布图,箱线图等
充分了解数据,再进行数据分析
import pandas as pd import numpy as np iris = pd.read_csv('./iris.csv') import matplotlib.pyplot as plt %matplotlib inline
fig = plt.figure() ax1 = fig.add_subplot(2, 2, 1) ax2 = fig.add_subplot(2, 2, 2) ax3 = fig.add_subplot(2, 2, 3) 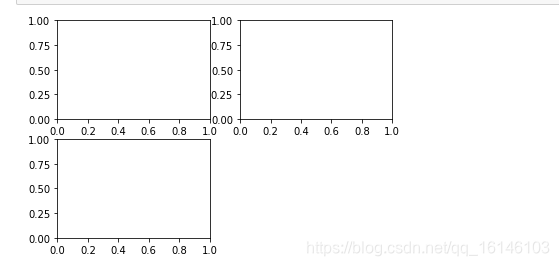

2、折线图
ax1 = plt.subplot(111) ax1.plot(iris['Sepal.Length'], 'k--', label='Sepal.Length') # 'k--' 为折现的形状或颜色,label为图例的名称 ax1.legend(loc='best') # 设置图例的位置 ax1 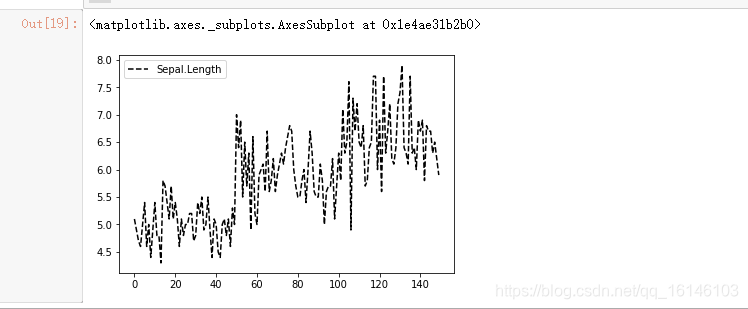
ax1 = plt.subplot(111) ax1.plot(iris['Sepal.Length'], 'b-', label='Sepal.Length') ax1.legend(loc='best') ax1 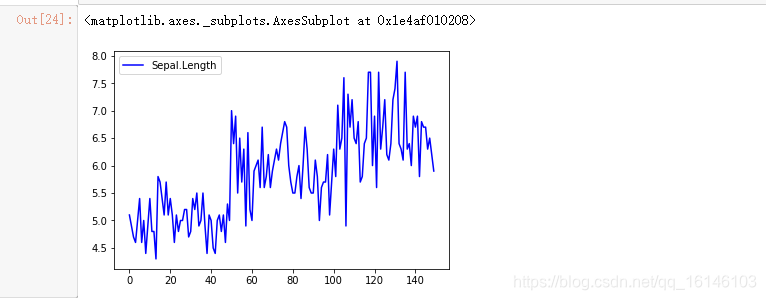
ax1 = plt.subplot(111) ax1.plot(iris['Sepal.Length'], 'r*', label='Sepal.Length') ax1.legend(loc='best') ax1 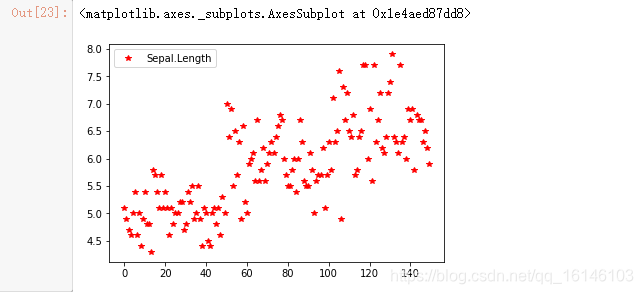
3、散点图
ax2 = plt.subplot(111) ax2.scatter(iris['Sepal.Width'],iris['Petal.Width'] , label= 'petal&sepal_width') ax2.legend(loc='best') plt.xlabel('Sepal.Width') plt.ylabel('Petal.Width') 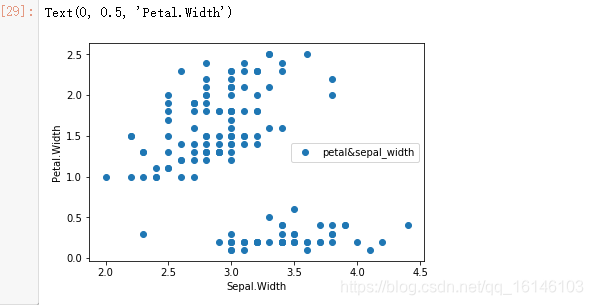
4、条形图
ax3 = plt.subplot(111) a = ax3.hist(iris['Sepal.Width'],bins =10, label='Sepal.Width') ax3.legend(loc='best') 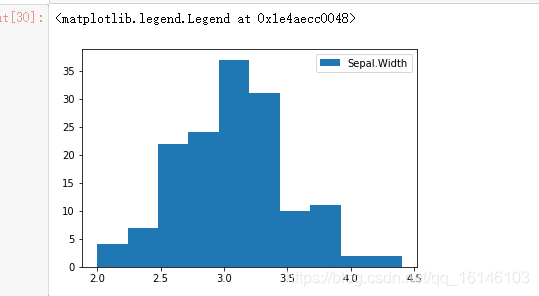
5、drawstyle
plt.plot(iris['Petal.Length'], drawstyle = 'steps') 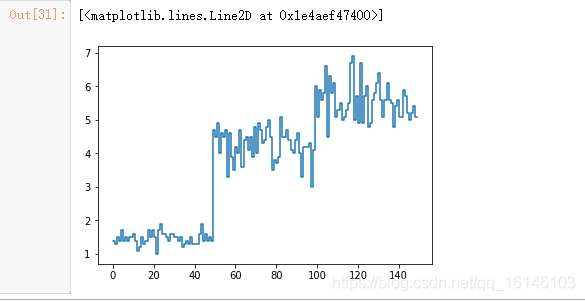
6、plt.xlim()&plt.ylim()
plt.plot(iris['Petal.Length'], drawstyle = 'steps') plt.xlim([0, 50]) 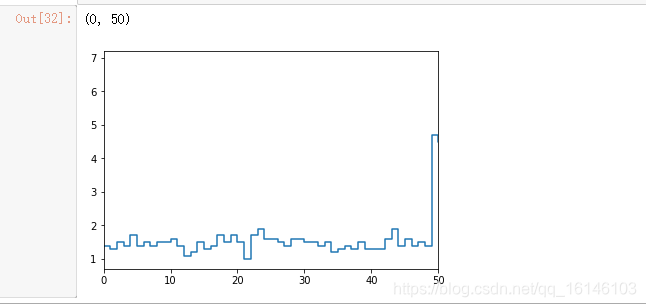
plt.plot(iris['Petal.Length'], drawstyle = 'steps') plt.ylim([0, 50]) 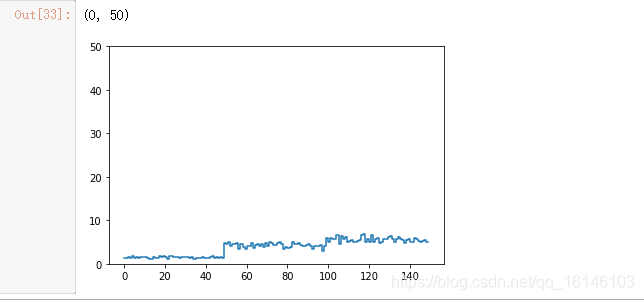
ax= plt.subplot(111) # 设置坐标轴现实 ax.plot(iris['Sepal.Length'], 'g-', label = '_nolengend_') # 设置坐标位置 ticks = ax.set_xticks([30, 60 , 90, 120]) # 设置该位置显示的文字,以及文字旋转角度,文字大小 labels = ax.set_xticklabels(['30', '60', '90', '120'], rotation = 50, fontsize = 'large') 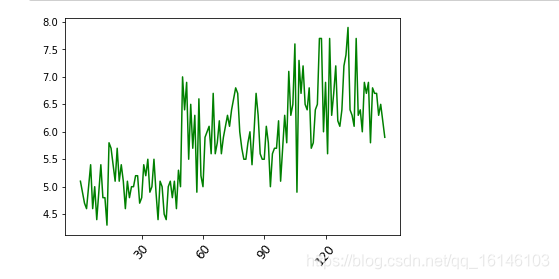
7、箱纸图
ax= plt.subplot(111) # whis指定离群点分割线 ax.boxplot(iris['Sepal.Length'], whis=2) # plt.title()设置标题 plt.title('box plot') # plt.ylabel()设置坐标轴名称 plt.ylabel('data content') 
本网页所有视频内容由 imoviebox边看边下-网页视频下载, iurlBox网页地址收藏管理器 下载并得到。
ImovieBox网页视频下载器 下载地址: ImovieBox网页视频下载器-最新版本下载
本文章由: imapbox邮箱云存储,邮箱网盘,ImageBox 图片批量下载器,网页图片批量下载专家,网页图片批量下载器,获取到文章图片,imoviebox网页视频批量下载器,下载视频内容,为您提供.
阅读和此文章类似的: 全球云计算
 官方软件产品操作指南 (170)