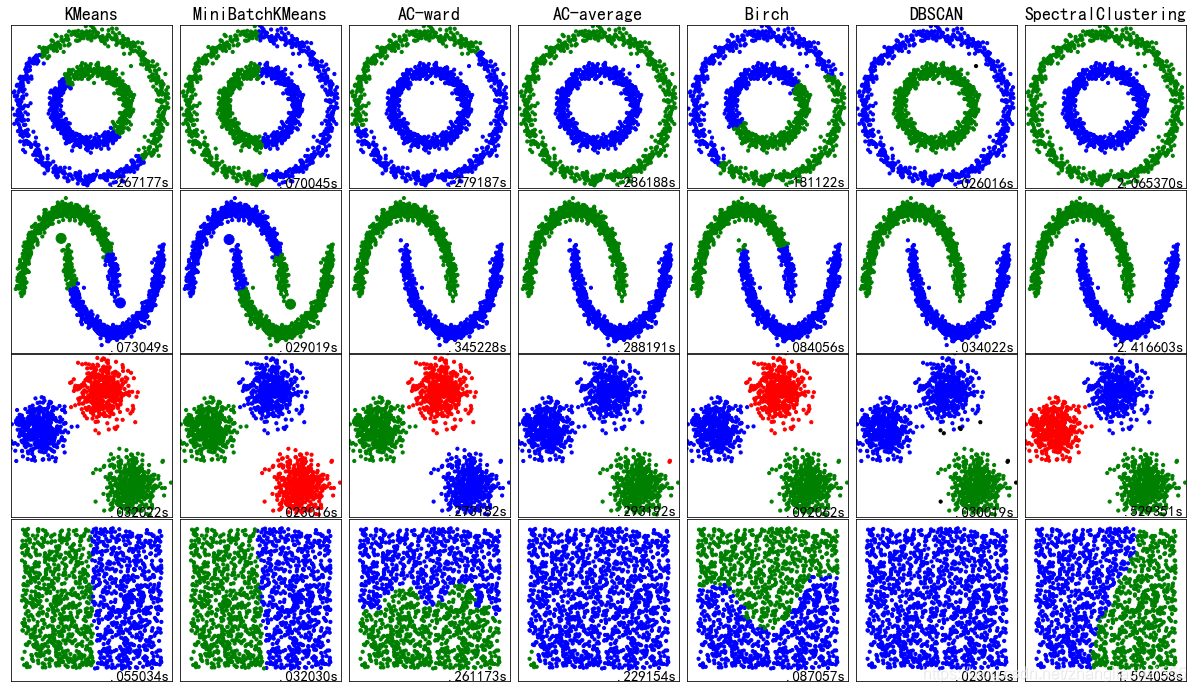
至此聚类相关的内容告一段落,前面十篇博客介绍了常见的几种聚类算法,也加入了一些代码实现。这篇博客来一个汇总的实例,分别创建圆形数据、月牙形数据、聚团数据以及随机数据,并测试不同数据在各种不同聚类算法中的聚类效果以及消耗时间。 最后看一下运行效果
import time import warnings import numpy as np import matplotlib as mpl import matplotlib.pyplot as plt from sklearn import cluster from sklearn import datasets as ds from sklearn.neighbors import kneighbors_graph from sklearn.preprocessing import StandardScaler ## 设置属性防止中文乱码 mpl.rcParams['font.sans-serif'] = [u'SimHei'] mpl.rcParams['axes.unicode_minus'] = False warnings.filterwarnings(action='ignore', category=UserWarning) ## 产生模拟数据 n_samples = 1500 np.random.seed(0) #产生圆形的 noisy_circles = ds.make_circles(n_samples=n_samples, factor=.5, noise=.05) #产生月牙形 noisy_moons = ds.make_moons(n_samples=n_samples, noise=.05) #高斯分布 blobs = ds.make_blobs(n_samples=n_samples, n_features=2, cluster_std=0.5, centers=3, random_state=0) no_structure = np.random.rand(n_samples, 2), None datasets = [noisy_circles, noisy_moons, blobs, no_structure] clusters = [2,2,3,2] clustering_names = [ 'KMeans', 'MiniBatchKMeans', 'AC-ward', 'AC-average', 'Birch', 'DBSCAN','SpectralClustering'] ## 开始画图 plt.figure(figsize=(len(clustering_names) * 2 + 3, 9.5), facecolor='w') plt.subplots_adjust(left=.02, right=.98, bottom=.001, top=.96, wspace=.05,hspace=.01) colors = np.array([x for x in 'bgrcmykbgrcmykbgrcmykbgrcmyk']) colors = np.hstack([colors] * 20) plot_num = 1 for i_dataset,(dataset, n_cluster) in enumerate(zip(datasets, clusters)): X,y = dataset X = StandardScaler().fit_transform(X) connectivity = kneighbors_graph(X, n_neighbors=10, include_self=False) connectivity = 0.5 * (connectivity + connectivity.T) km = cluster.KMeans(n_clusters=n_cluster) mbkm = cluster.MiniBatchKMeans(n_clusters=n_cluster) ward = cluster.AgglomerativeClustering(n_clusters=n_cluster,connectivity=connectivity, linkage='ward') average = cluster.AgglomerativeClustering(n_clusters=n_cluster,connectivity=connectivity, linkage='average') birch = cluster.Birch(n_clusters=n_cluster) dbscan = cluster.DBSCAN(eps=.2) spectral = cluster.SpectralClustering(n_clusters=n_cluster, eigen_solver='arpack', affinity="nearest_neighbors") clustering_algorithms = [km, mbkm, ward, average, birch, dbscan, spectral] for name, algorithm in zip(clustering_names, clustering_algorithms): t0 = time.time() algorithm.fit(X) t1 = time.time() # 如果模型中存在"labels__"这个属性的话,那么获取这个预测的类别值 if hasattr(algorithm, 'labels_'): y_pred = algorithm.labels_.astype(np.int) else: y_pred = algorithm.predict(X) # 画子图 plt.subplot(4, len(clustering_algorithms), plot_num) if i_dataset == 0: plt.title(name, size=18) plt.scatter(X[:, 0], X[:, 1], color=colors[y_pred].tolist(), s=10) # 如果模型有中心点属性,那么画出中心点 if hasattr(algorithm, 'cluster_centers_'): centers = algorithm.cluster_centers_ center_colors = colors[:len(centers)] plt.scatter(centers[:, 0], centers[:, 1], s=100, c=center_colors) plt.xlim(-2, 2) plt.ylim(-2, 2) plt.xticks(()) plt.yticks(()) plt.text(.99, .01, ('%2fs' % (t1 - t0)).lstrip('0'), transform=plt.gca().transAxes, size=15, horizontalalignment='right') plot_num += 1 plt.show()
本网页所有视频内容由 imoviebox边看边下-网页视频下载, iurlBox网页地址收藏管理器 下载并得到。
ImovieBox网页视频下载器 下载地址: ImovieBox网页视频下载器-最新版本下载
本文章由: imapbox邮箱云存储,邮箱网盘,ImageBox 图片批量下载器,网页图片批量下载专家,网页图片批量下载器,获取到文章图片,imoviebox网页视频批量下载器,下载视频内容,为您提供.
阅读和此文章类似的: 全球云计算
 官方软件产品操作指南 (170)
